Annual Report 2019-20
Published 23 November 2020Our finances
Current year financial review
Our primary fiscal objective is to minimise our costs to government and our fee-paying industries while maintaining our effectiveness and quality of services.
In 2019–20, we achieved an operating surplus of $0.149 million, $1.511 million lower than in 2018–19. A summary of our financial performance is outlined below and shows the movements in actual income, expenses, balance sheet items and net cash flow.
Financial summary 2019–20 and previous 4 years
|
Comprehensive operating statement |
2019–20 |
2018–19 |
2017–18 |
2016–17 |
2015–16 |
|---|---|---|---|---|---|
|
Total income from transactions |
28,728,156 |
25,349,539 |
24,316,269 |
23,948,697 |
19,599,126 |
|
Total expenses from transactions |
28,539,801 |
23,554,425 |
24,029,804 |
21,769,240 |
18,351,057 |
|
Net result from transactions |
188,355 |
1,795,113 |
286,465 |
2,179,457 |
1,248,069 |
|
Comprehensive result |
149,263 |
1,660,295 |
290,004 |
2,113,707 |
1,186,283 |
|
Balance sheet |
|||||
|
Total assets |
23,301,400 |
19,211,562 |
17,546,737 |
16,689,963 |
13,815,973 |
|
Total liabilities |
9,150,481 |
5,380,733 |
5,376,203 |
4,809,434 |
4,049,151 |
|
Net assets |
14,150,919 |
13,830,829 |
12,170,534 |
11,880,529 |
9,766,822 |
|
Cash flow |
|||||
|
Net cash flow from operating activities |
1,505,481 |
180,329 |
33,565 |
13,271 |
14,047 |
Our finances in 2019–20
Our financial position remains strong with total assets of $23.301 million, total liabilities of $9.150 million and total net assets of $14.151 million.
- $23.30 million in assets
- $14.151 million in net assets
- $9.15 million in liabilities
We recorded an operating surplus of $0.149 million in 2019–20 compared to $1.660 million in 2018-19.
- $0.149 million surplus
Surplus/deficit
We operate in a fiscally responsible and sustainable manner, managing to the funding provided by government with a surplus each year, at an average of five per cent per year, to increase reserves to fund future projects.
Any application to prior years surpluses are subject to approval by the Treasurer.
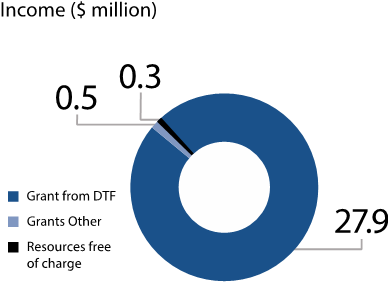
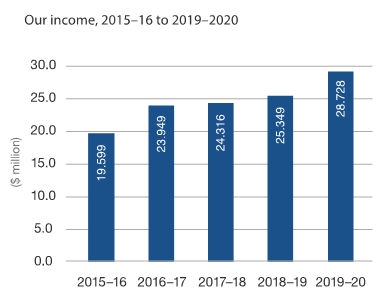
Income
We are funded through parliamentary appropriations on-passed as a grant through the Department of Treasury and Finance.
Our total revenue has increased over the past five years (47 per cent since 2015–16) as a result of an increase in regulatory functions (for example, expanded customer protection responsibilities in energy in the government’s Energy Fairness Plan) and the expansion of the Victorian Energy Upgrades program.
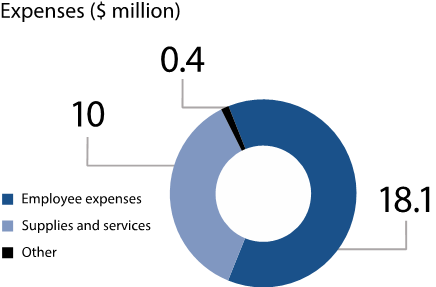
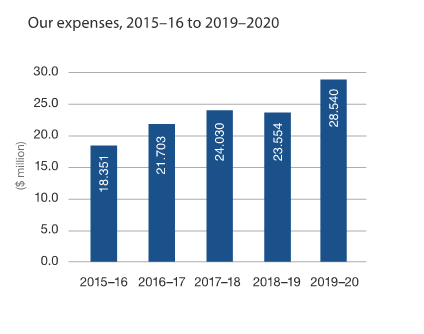
Expenses
We incurred $28.5 million in expenses from transactions for the reported financial year. There was an increase in expenditure this year which was largely related to delivery of the government’s Energy Fairness Plan.
Our expenditure has increased over the last five years in line with our income as a direct result of additional initiatives and increased regulatory requirements imposed by government.
In March 2020, all commission staff moved from working in the office to working from home due to coronavirus pandemic. This and other effects of the pandemic on our suppliers and contractors has caused some delays in the delivery of IT projects and the move to new office accommodation. We have carried over $1.988 million appropriation funding from 2019–20 to 2020–21 to deliver these projects.
Assets and liabilities
Our financial position remains strong with total assets of $23.3 million, total liabilities of $9.2 million and net assets of $14.2 million. Significantly, our working capital is sufficient to fund our operations over the forward estimates period.
Net assets as a percentage of total assets
|
|
2019–20 |
2018–19 |
2017–18 |
2016–17 |
2015–16 |
|---|---|---|---|---|---|
|
Net assets |
60.73% |
71.99% |
69.36% |
71.60% |
70.69% |
Our major asset is the receivable from the Victorian Government. This amount includes previously applied parliamentary appropriations that we have not yet drawn on. The balance represents the accumulated surplus (which can only be drawn down on after the approval of the Treasurer), accrued employee entitlements, payables and accumulated depreciation.
The balance, net of the accumulated surplus, represent funding for commitments incurred through the appropriations and are drawn from the consolidated fund as the commitments fall due. Total liabilities increased to $9.15 million. Our major liabilities are accounts payable and employee provisions.
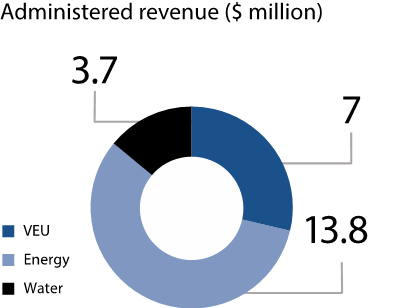
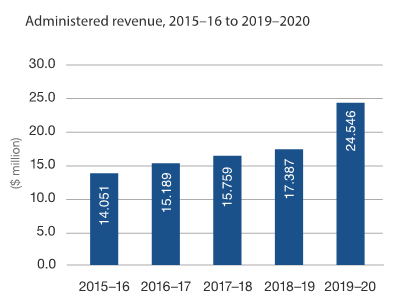
Administered revenue
We also collect administered revenue on behalf of the State of Victoria that is paid into government’s consolidated revenue. The revenue includes licence fees and penalties for the regulation of the energy and water industries. It also includes fees for the Victorian Energy Upgrades program as well as any penalties relating to that program. We collected $25.46 million administered revenue in 2019–20 compared to $17.387 million in 2017–18.
The year ahead
We were allocated $27.3 million over four years in the 2019–20 State Budget. This funding is allowing us to deliver on the government’s Energy Fairness Plan through reforms to pricing and marketing practices, and the strengthening of the commission’s enforcement powers. This has included the implementation of the Victorian Default Offer, and new requirements for energy retailers in billing, marketing and contract terms and conditions. In addition, our enforcement and investigative powers are further strengthened to improve the effectiveness of our monitoring of energy markets and retailers.
For 2020–21 this will mean an increase in appropriation funding to $31.44 million from $27.878 million in 2019–20 and $24.972 million in 2018–19. Appropriation funding this year includes carryover funding of $1.400 million output appropriation and $0.588 million capital funds from 2019–20 to 2020–21.